
Bacterial blast doesn’t occur every year, so when there are a large number of orchards affected, it is natural to want to look for patterns in the occurrence and severity. One of the orchards affected in 2017 was the Regional Almond Variety Trial at the Chico State University Farm. This setting gives us a controlled orchard at which to compare the incidence of bacterial blast on the 30 varieties planted in the orchard.
There were four nights where temperatures were recorded below 30ᵒF while the trees were in the peak bloom period (Feb 23, 24, 26 & 28). On March 13, I walked one replicate (12 trees/variety) within the orchard and rated each variety for the presence & severity of bacterial blast. I rated trees on a 0-5 scale, where 0-1 was few or no blasted flowers observed, 2-3 was some blast, and 4-5 was severe blast symptoms (see photo below). The majority of varieties (25) had a rating between 0-2, while just a few varieties (5) had severe damage.
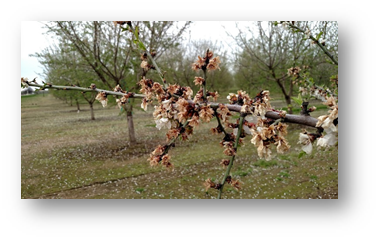
Trees rated with severe symptoms had a substantial majority of branches with clusters of blasted flowers.
Many growers and PCAs commented to me that the problem seemed to be worse on rootstocks with plum heritage (Marianna 2624 and Krymsk 86). The variety trial is planted on K86, however, there is one replicate of the variety ‘Kester’ planted on both K86 and Hansen rootstock; neither had severe blast.
On Hansen, blast on ‘Kester’ was rated 1; with ‘Kester’ on K86, blast was rated 2. The difference between rootstocks with and without plum genetics was insignificant since ‘Kester’ was not particularly susceptible to blast.
Another question is whether there was a relationship between when the trees were in full bloom and the severity of bacterial blast symptoms. After removing the variety UCD 3-40 (an early blooming variety that had reached 100% petal fall by the frosty nights), I graphed the severity ratings against the dates that the trees were in full bloom. There was no relationship between full bloom timing and blast symptoms observed (Figure 1).
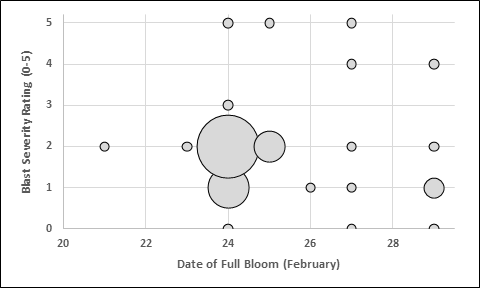
Figure 1. Relationship between the date of full bloom and the observed severity. The larger bubbles represent a greater number of varieties with the given rating on that bloom date. There was no relationship between full bloom timing and blast symptoms observed.
Since bloom timing was not a major influence on whether varieties had blast, we can look at which varieties within the trial were most and least susceptible:
| Least Susceptible with Ratings 0-1 Variety (source) | Most Susceptible with Ratings 4-5 Variety (source) |
| Nonpareil | Self Fruitful P13.019 (Burchell) |
| Supareil (Burchell) | Self Fruitful P16.013 (Burchell) |
| UCD 1-232, UCD 1-16, UCD 18-20 (UC Davis) | Y 116-161-99 (USDA) |
| Winters (UCD) | Wood Colony |
| Sterling (Burchell) | Bennett (Duarte) |
| Y 117-91-03 (USDA) | |
| Sweetheart (UCD) | |
| Kester on Hansen rootstock (UCD) |
Leave a Reply