
Franz Niederholzer, UCCE Farm Advisor, Colusa and Sutter/Yuba Counties
Luke Milliron, UCCE Farm Advisor, Butte, Glenn, and Tehama Counties
Richard Buchner, UCCE Farm Advisor Emeritus Tehama and Glenn Counties
Adapted for 2023 harvest by Becky Wheeler-Dykes, UCCE Farm Advisor, Glenn, Tehama and Colusa Counties
With high fruit sets and good growing conditions in 2023, maximize grower income by focusing on harvest timing and field sizing. The keys to a timely harvest are 1) get the largest, high-quality fruit to the dryer and 2) field sort to keep small, low value fruit out of the bins.
Harvest timing:
Properly timed harvest delivers the best grower returns and best quality fruit to market. Fruit in an orchard is mature and ready to harvest once average internal pressure drops below 4 lbs.
Early harvest: shaking when the average pressure is more than 4 pounds “leaves money on the tree”; the fruit isn’t finished putting on dry weight. Shaking late, when the fruit is very soft, risks crop loss if winds pick up and ripe fruit drops to the orchard floor (early drop). The target start time is 3 to 4 lbs internal pressure. Each week, fruit pressure generally drops 1.5 pounds pressure (faster rate in cool weather, slower rate in hot weather) and sugars increase around 2%. Sugar increase occurs by fruit dehydration (concentration) once the fruit is mature (internal pressure is in the 3-4 lb range).
The following are UC recommended steps to measure prune fruit maturity:
- Sample 25 fruit from the block by sampling five fruit from five trees. Take fruit from the inside and outside of the canopy. Flag the trees so that the same trees will be used each week.
- Slice the skin off the fruit “cheeks” on both sides of each fruit. Just remove the skin, take as little flesh off as possible. *Save the fruit for sugar testing after pressure testing as described below.
- Measure fruit firmness on each cheek using a “fruit pressure tester” with a 5.16” tip.
- Calculate the average pressures per fruit and record that number. Then, calculate the average fruit pressure for the block. Use the average fruit pressure to determine harvest timing but watch for very low pressures that might indicate early drop of some fruit.
- Track fruit pressure each week to determine harvest timing.
- PRUNES ARE MATURE BETWEEN 3-4 POUNDS PRESSURE. When timing harvest start, growers must consider the number of acres to shake, available dryer space, tree age/cropload and fruit pressures in each block. For example, it may be better to start early in the youngest orchard with a light crop and high sugars and then move to older, heavier cropping orchard with lower sugars afterwards. This gives the older block a few more days to improve sugar level.
Field sizing:
Small fruit (C screen or smaller) are worth less than A and B screen fruit but maximizing large fruit production (and net grower returns) means growing some small fruit. This likelihood is even higher in 2023 with such heavy crop-loads. We recommend growers take time and estimate dry fruit size ahead of harvest to help with field sizing decisions. Each grower must make their own decisions based on the crop in their orchard and pricing information from their packer.
Before we get into sampling details in a particular orchard, here is a critical point. Field sizing is worth doing, but impossible to do perfectly. Why is perfect field sizing such a challenge? Fresh fruit size and fruit sugar concentration (% soluble solids) determines dry fruit size (see “Claypool Table”; Table 1). Field sizers, working properly with careful fruit flow on the receiver, drop fresh fruit of a certain diameter (assuming all the fruit has the same pressure). But sizers can’t tell individual fruit sugar levels. Fruit of the same fresh size but different sugar content will have different dry fruit sizes. That difference in fresh fruit sugar level can be the difference between a B or C screen dry fruit. For example, a medium (27 fresh fruit/lb) sized fresh fruit should make a dry fruit in the range of 71 to 81 ct/lb size (based on the Claypool Table) if the fruit had 26% SS or 20% SS, respectively. So, for that same sized piece of fresh fruit, differences in sugar level will either deliver good value or poor value to the grower. But it’s impossible to tell which will be which by fresh fruit size alone. Predicting, from field measurements, the fruit size in the orchard heading into harvest will help growers decide how aggressively they want to field size.
Field sizing is a lot like fruit thinning; there is a lot of art and experience mixed in with science. First, know what the crop looks like in your orchard. Use the Claypool Table (Table 1) to estimate the average dry fruit size in your orchard. It is very important to note that this table is not perfect and tends to be generous, predicting larger average dry fruit size for certain sugar values than actually were delivered. While it is a good estimate, the table results are anecdotally about 10% larger than what processors actually see after drying.
The following is a sampling program to estimate average dry fruit size in an orchard suggested by Bill Olson (UCCE Farm Advisor, Butte Co, retired) in a 1999 newsletter. The sampling program has been embedded in an excellent online calculator for ease of use in your orchard.
Follow these steps to estimate average dry fruit size for an orchard:
Estimate fresh fruit per pound.
- At the beginning of harvest, take several (~4) 100 fruit samples from each orchard. Each sample = 100 fruit (20 fruit from each of 5 trees). Be sure to sample both fruit clusters inside and outside of the tree at eye level.
- Weigh each fresh sample (100 fruit per sample) separately.
- Divide the number of fruit in each sample (100) by the weight of the sample (in lbs) to determine number of fresh fruit per pound.
- Average the four fresh fruit counts for the field.
Determine percent soluble solids.
- Cut 25 fruit in half from the stem to the blossom end, slicing along a flat side of the pit.
- Put all 25 fruit halves (the side without the pit) in a blender and puree the fruit.
- Squeeze fruit juice from the puree through a cheese cloth or paper towel onto a refractometer and determine percent soluble solids (sugars). *There is usually less sugar in the fruit flesh closer to the pit, so this method usually delivers a lower % SS value than if flesh from just under the skin is used.
- Average the soluble solids values for all samples for the field. *Different areas in the orchard could be harvested separately if differences in crop exist that may warrant different harvest timing.
Use the Claypool Table (Table 1, below) to predict your dry count/lb based on your average fresh count/lb and soluble solids for the orchard. Compare that average with the previous year average fruit number and P1 values for different screen sizes to get a sense of the percentage of C screen and smaller fruit in the current crop. That will help you decide how big a sizer to run. Growers who thinned in the spring should have less small fruit on the trees at harvest than if they hadn’t thinned. Please note: The “Claypool Table” was developed by Dr. L.L. Claypool (UC Davis) in the 1950’s. Recent research shows that this table can overestimate dry fruit size by an average of 10% and so should be considered only a guideline in estimating average dry fruit count/lb before harvest.
Check the results of field sizing before and during harvest. Set a chain size, and collect the fruit dropped through that chain size by placing a tarp on the ground under the sizer. Run a fresh fruit count and sugar check to compare with the Claypool Table to see, in general, what size fruit is being dropped. Adjust chain size up or down as needed in that orchard. Once harvest has started, check size and sugar of fruit dropped through the chain several times during the season. This is especially important later in the season as the fruit softens.
Finally, during harvest, make sure the belts feeding the sizing chain are run slowly enough that all the fruit is run across the sizer in a single layer — so it can be sized. If the sizing chain has too much fruit on it, all fruit will not be sized and some smaller fruit that should have dropped out will be delivered to the dryer.
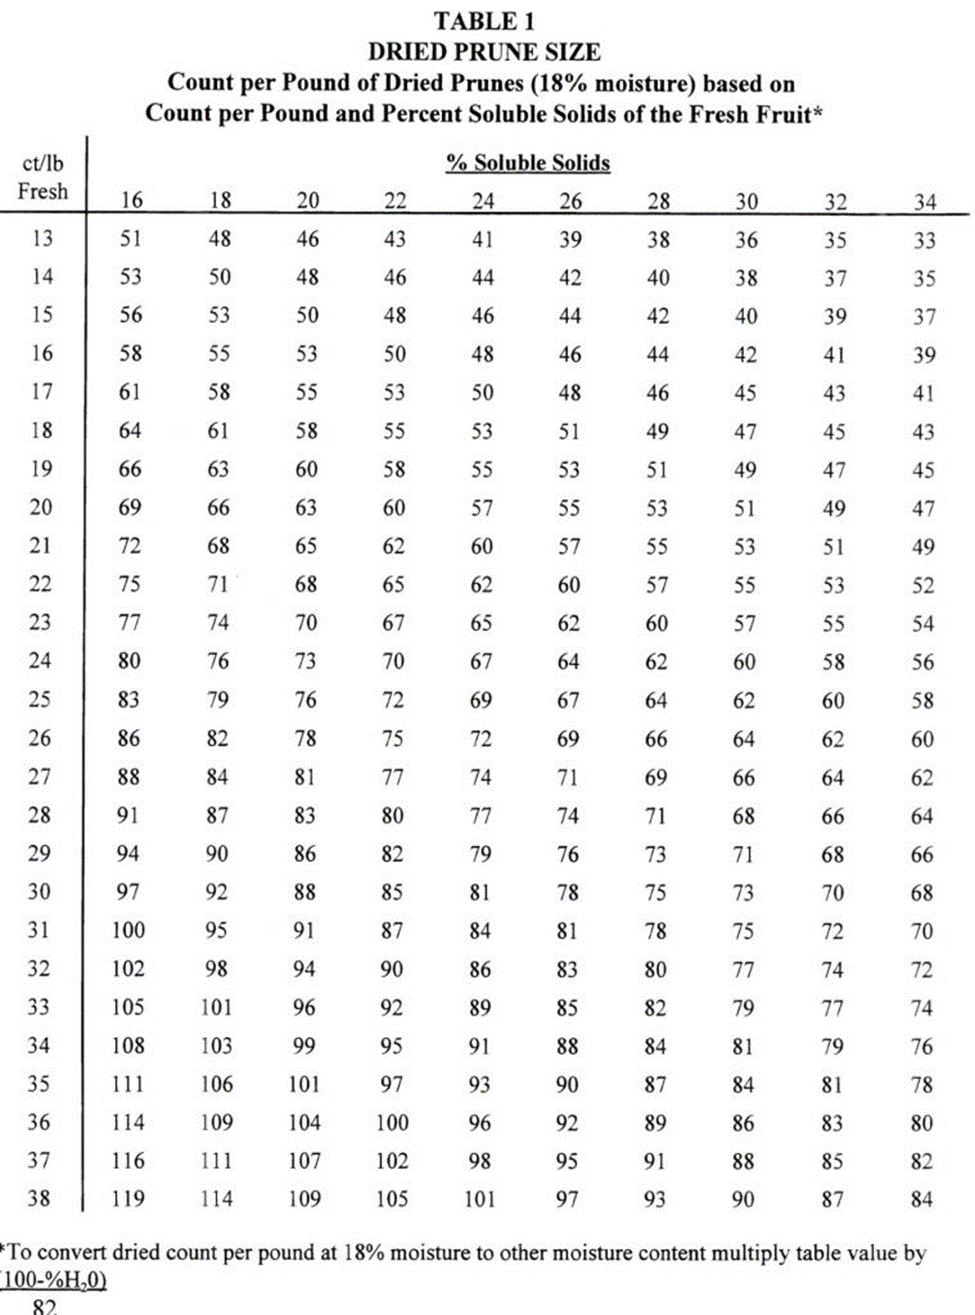
Table1. Claypool table to predict your dry count/lb based on your average fresh count/lb and soluble solids for the orchard.
Leave a Reply