

Ken Shackel, Plant Sciences Department, UC Davis
Allan Fulton, UCCE Soil and Water Advisor, Emeritus
Kari Arnold, UCCE Orchard & Vineyard Advisor, Stanislaus County
Bruce Lampinen, UCCE Specialist, UC Davis
Luke Milliron, UCCE Orchard Advisor, Butte, Glenn, & Tehama Counties
Walnuts are generally regarded as very sensitive to water stress. Severe stress and defoliation can occur when irrigation is reduced in the summer or discontinued entirely for harvest. Since walnuts depend on stored soil moisture during this time, growers were historically advised to start irrigation early in the spring to save deep soil moisture ‘in the bank’ for use later in the season. However, research findings in a Red Bluff, CA walnut orchard have seriously challenged this conventional wisdom. In fact, trees that were given an early start of irrigation (late April), showed more water stress at harvest than trees that were given a delayed start of irrigation (late May/early June). Surprisingly, this occurred despite the fact that the delayed start trees received substantially less water (about 28 inches over the course of the growing season) than the early start trees (about 38 inches). The Red Bluff orchard is on a deep silt-loam/fine sandy-loam soil, but similar results are being found in one Stanislaus County orchard on a heavier clay soil and one orchard in western Tehama County on stratified soils, with gravelly subsoils and much lower water holding capacity.
Using the right tool:
In many commercial orchards, in-season tree water stress is monitored by measuring midday stem water potential (SWP) using a pressure chamber, (a.k.a. “pressure bomb,” see this site). This same tool could be used specifically to decide when to start irrigation in the spring, with the appropriate information on this subject. As a starting point, there is a reference level of SWP that is expected for a fully irrigated (non-stressed) walnut tree, which is called the “Baseline” SWP. For more information about baseline SWP and how to obtain this value for a particular location, day, and time, we suggest the following websites:
Baseline and advanced interpretation explained
Baseline values calculated for you
Using the tool to trigger the start of irrigation:
We began testing in 2014 in a 9-year old commercial Chandler/Paradox orchard planted at 18 x 28 ft (86 trees per acre) on a deep, well-drained silt-loam/fine sandy-loam soil near Red Bluff, CA. The test continued through 2019. The design of the experiment was simple: we compared control trees given 100% irrigation (see below) starting about 30 days after leafout, to trees which were not irrigated until a trigger level of SWP was reached. We tested five trigger levels for the start of irrigation: a grower control (typically starting irrigation while the trees were still near baseline SWP), or 1, 2, 3, or 4 bars drier than baseline SWP.
We divided the field into 4 row X 11 tree plots and had 5 individual plots for each trigger level. All total, the test consisted of 12.5 acres. Starting after leafout (about the third week of April), we measured the SWP of 2 middle trees in each plot every three or four days, and when the average of those trees reached the trigger on 2 consecutive dates, we opened the sprinkler control valves to the tree rows in that plot. From then on, the plot was irrigated whenever the control plots and the rest of the orchard was irrigated.
Initial results in 2014:
We expected that a 1 or 2 bar trigger might cause mild water stress with minimal effect on the trees, but that the 3 or 4 bar triggers would show some detrimental effects. However, we were not sure how long of a delay would result by waiting to start irrigation using any of these trigger levels. We were also not sure if trees with late triggers would always be ‘behind’ in their water needs, and would experience severe water stress at harvest, because we couldn’t apply a ‘catch up’ irrigation to any of the trees that were delayed. In 2014, the 1 bar trigger occurred about the same time as the grower control, but much to our surprise, waiting for the 2 bar trigger gave 1 – 2 months of delay (depending on the plot), with the 3 and 4 bar triggers giving slightly longer delays (Table 1).
Longer delays also resulted in less irrigation. In 2014, the control trees received 100% of calculated evapotranspiration (ET, see this publication), whereas the 1 through 4 bar trees ranged from 89% to 66% of this value, respectively (Table 1). There were some negative effects on crop yield, with the 4 bar trigger reducing yield by about 10% (Table 1), but there were also some positive signs. For instance, at harvest in October, the 2, 3, and 4 bar triggers had a healthier canopy appearance than the controls. This matched our SWP measurements, which indicated that the delayed trees were actually less stressed than the controls (Table 2). This was the most surprising result from the first year of the study: during the delay period (May, June) the longer delays were associated with more stressed (more negative) SWP values, as expected, with the controls being closest to the baseline. However, by harvest, the opposite was the case, with the controls being furthest from the baseline (Table 2).
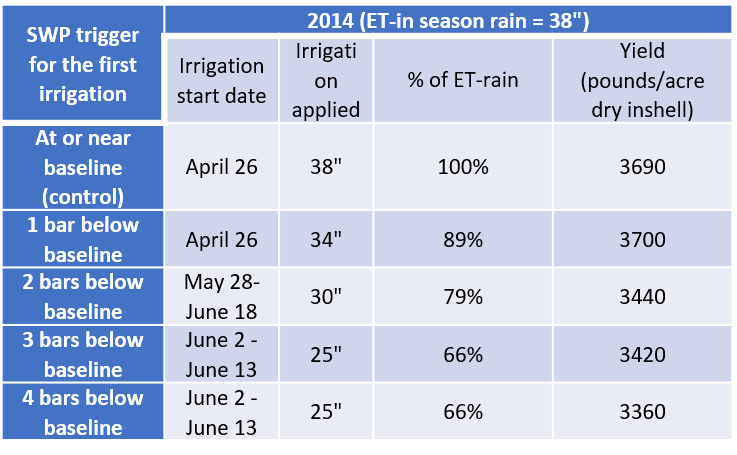
Table 1. Irrigation start dates, seasonal irrigation applied (in inches and as the equivalent percent of irrigation requirement, calculated from ET minus in-season rainfall), and crop yield, for each of the irrigation treatments imposed in the first year of the study (2014).
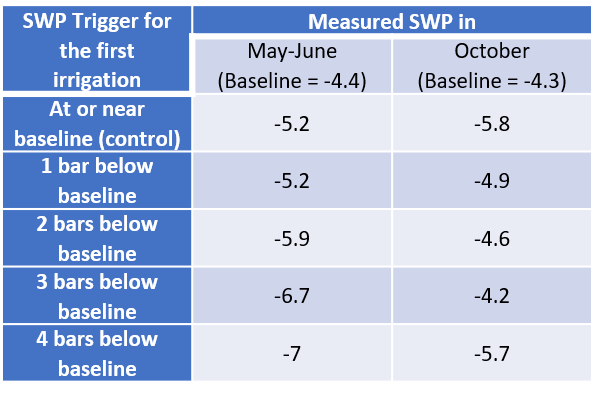
Table 2. Average SWP measured in May and June 2014, when irrigation was being delayed in most of the treatments, and average SWP in October around harvest (October 17, 2014). Also shown are the baseline SWP values for the same time periods.
Trial results for 2015-2018:
Due to the overall improved appearance of trees in the delayed plots at harvest compared to the controls, the grower’s standard (control) irrigation start time in the entire orchard, including our control plots, was gradually delayed each year after 2014. Water applications in the orchard and the control plots became substantially less than 100% of the seasonal irrigation need (Table 3). Yields also generally improved across treatments compared to 2014, even though canopy size, as measured by midsummer ground shaded area, has remained stable at 86%. Even with the changes over time that occurred in the control trees, delays associated with a 1 to 4 bar trigger showed small but consistent improvements in percent edible yield and relative value, and a substantial savings in water (Table 3). There were also indications of small but consistent increases in nut load, but since nut load is determined by many factors, ongoing research in additional orchards is being conducted to determine if this effect is consistent.
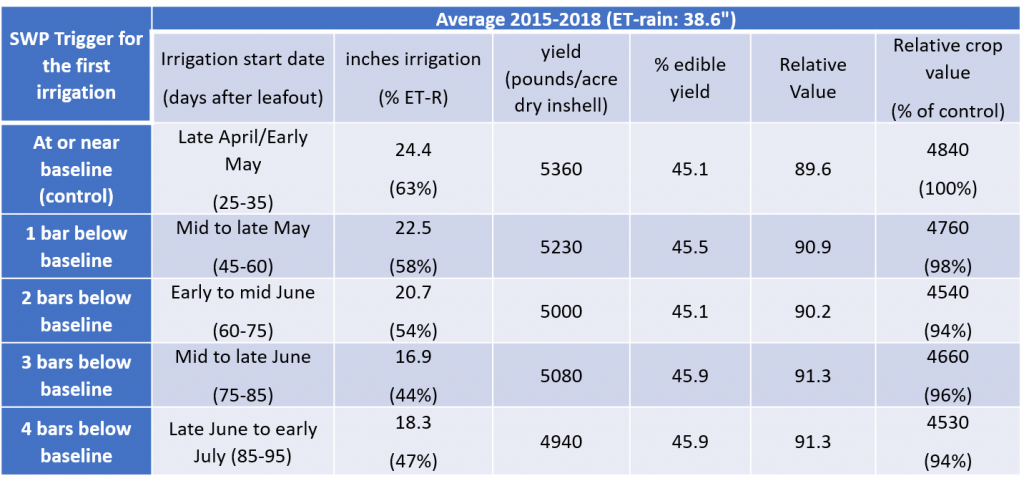
Table 3. Average irrigation start date (and equivalent days after leafout), seasonal irrigation applied in inches (and equivalent percent of the seasonal irrigation requirement, as in Table 1), yield, percent edible yield, relative value, and crop relative value (and equivalent percent of the control treatment). Relative value is an index combining the two main economic drivers of walnut value (percent edible yield and kernel color), and crop relative value is Yield x Relative value. (Click on the table to see an enlarged version.)
Soil moisture storage & possible implication for root health:
The soil in this location is a deep, well-drained silt-loam/fine sandy-loam, and soil moisture measurements have indicated that the trees in this orchard have access to at least 10 feet of stored soil moisture. In most years, rainfall is also sufficient to refill this soil profile. Hence, using the pressure chamber to determine when to start irrigating has enabled the grower to take maximum advantage of this soil moisture resource. At the same time, allowing the trees to use stored soil moisture in the spring may improve soil aeration and overall root health. This may be one of the reasons why the delayed trees appeared healthier and were less stressed around harvest compared to the controls. Answering this question with greater confidence will require more research focused on the root system.
Taking the delay of irrigation with SWP practice beyond Red Bluff:
It is also important to test the delayed irrigation approach on different soil types. Because this project was conducted in a relatively high rainfall area in the Sacramento Valley, extending these dramatic results to other areas in the state with differing rainfall and soils should be done with caution. We currently have two different trials underway to further test the merits of delaying the start of irrigation in walnut. A second site in Stanislaus County on a heavier clay soil and a third trial in western Tehama County on stratified soils, with gravelly subsoils and much lower water holding capacity. Both trials are a smaller scale version of the Red Bluff trial.
In a Stanislaus orchard consisting of Chandler on Vlach, results after three years suggest that similar benefits of delaying the first irrigation may be possible in this higher clay content soil site. Some ailing trees have shown partial recovery in the delay treatment, indicating the possibility of too much water being applied too early (figure 1). Yield at the Stanislaus site was not affected when irrigation was withheld until readings of 2 bars drier than baseline.
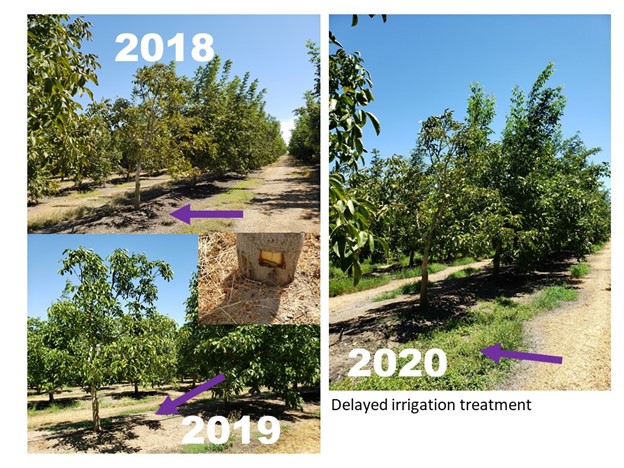
Figure 1. An ailing tree at the Stanislaus site in 2018 showed signs of deterioration. Although the trunk was somewhat sunken at the soil line and necrosis was forming under the bark (center photo), samples were collected multiple times but no Phytophthora spp. were isolated/found. This tree happened to be included in the delay irrigation treatment and during the passing of three years appears to be recovering, specifically showing greater shade under the tree canopy at midday since the beginning of the trial in 2018 (photos by K. Arnold).
After two years, results from the western Tehama County test on soils with lower water holding capacity and soil layers that may restrict root depth, suggest there may still be some benefit of delaying irrigation in terms of less tree stress at harvest, reduced water costs, and improved edible kernel. However, as might be expected because of the lower water holding capacity of the soils, the delay may only be about one to two weeks with water savings of about four inches.
A key feature of using SWP to manage irrigation is that it provides growers with an orchard-specific measure of tree water stress, and hence allows them to safely take advantage of the existing soil moisture resource, regardless of soil depth, type, and the quantity of stored soil moisture. Using SWP to delay the start of irrigation resulted in healthier looking, less water stressed trees at harvest, challenging the conventional wisdom that an early start to irrigation is beneficial because it allows the saving of deep soil moisture ‘in the bank’ for use later in the season. Quite possibly, keeping this savings account too full in the spring may cause more problems than it solves.
The benefits of waiting to irrigate in spring until trees read 2 to 3 bars drier than the baseline despite the stark differences between these three sites, is a powerful testament to the value of using the pressure chamber. Once growers use the pressure chamber to trigger the start of irrigation, they can continue to trigger irrigations throughout the season by waiting for SWP readings of 2 to 3 bars drier than the fully watered baseline.
Baseline and other information for interpreting SWP readings can be found here.
These trials are also challenging the conventional wisdom that we must irrigate to keep up with ET to have healthy and high-yielding walnut orchards (Figure 2). Stay tuned as these two new trials continue to add to our collection of experiences.
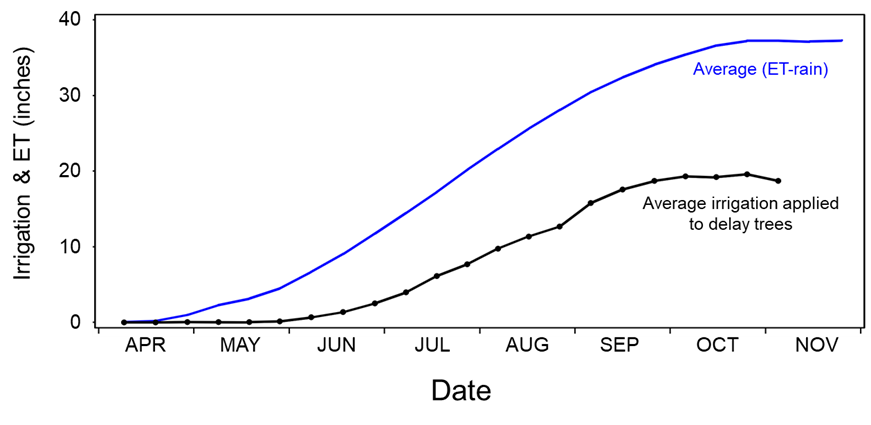
Figure 2. Summary of average orchard water requirement (ET-rain) and applied irrigation for all delayed irrigation tests to date (2014 – 2020). Daily CIMIS values for orchard water requirements were calculated beginning on April 1, based on current walnut crop coefficients, for each site and year, and averaged. Irrigation applied to all delayed treatments for each site and year were averaged for 10 day periods over the same seasons.
Leave a Reply