
Dani Lightle, UCCE Orchards Advisor, Glenn, Butte & Tehama Cos.; Cynthia Creze, PhD Student, UC Davis; & Amélie Gaudin, Department of Plant Sciences, UC Davis
Almond growers have indicated interest in the use of cover crops, but grower surveys indicate that lack of best management practices and concerns about expected returns continue to prevent wider adoption of cover cropping practices. Our current research aims to look at benefits and trade-offs of cover crops across almond production systems. Research trials are replicated in producing almond orchards with micro-sprinkler irrigation across three production regions: Tehama, Merced & Kern counties. Data are being collected on the performance of two cover crop mixes, different termination dates, weed population shifts, beneficial and plant parasitic nematodes, frost risk, impacts on navel orangeworm sanitation or honeybee pollination, water usage, soil health and tree nutrition, and yield.
Winter 2017-18 was the first year of this study and cover crops will be planted again in fall 2018. This article presents a brief overview of preliminary data on cover crop establishment and orchard frost risk.
Cover crop biomass and performance. All study sites planted four replicates of two different cover crop mixes: a soil mix, providing diverse root architectures and N-fixation to improve soil health, and a pollinator mix, designed to attract bees and provide pollinator habitat (Table 1). Both mixes contain radish to address compaction and water infiltration concerns, as well as white mustard for pollinators.
The biomass produced was proportional to the amount of precipitation received at each site: the Tehama site had the most rain and most biomass while the Kern county site had the least. However, the species composition varied widely among sites (Figures 1 & 2). For example, in rows planted to the soil mix in Tehama county, 60% of the biomass was white mustard, while in Merced county, 59% of the biomass was ryegrass. These results show that the cover crop mix composition should be carefully considered, possibly by region or anticipated precipitation, especially if a certain cover species or purpose is desired.
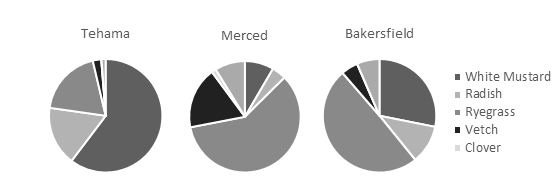
Figure 1. Soil mix species composition by dry-matter weight proportion at time of termination at each site. The species in the soil mix are listed in Table 1. Termination dates were March 30th (Tehama County), April 10th (Merced County), and April 2nd (Kern County).
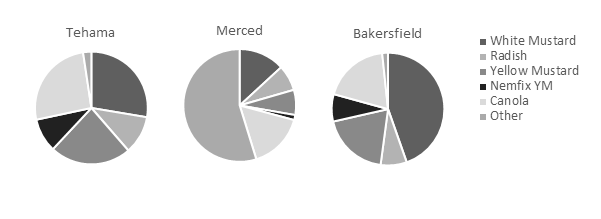
Figure 2. Pollinator mix species composition by dry-matter weight proportion at time of termination at each site. The species in the pollinator mix are listed in Table 1. Termination dates were March 30th (Tehama County), April 10th (Merced County), and April 2nd (Kern County).
Frost risk (Tehama County). The goal was to monitor the microclimate above the cover crop compared to rows containing only resident vegetation to understand how orchard temperatures fluctuate and whether cover crops heighten frost risks. The most critical time period for frost damage was February 19-28, 2018. During this time period, average biomass was 63% greater in cover cropped plots, though normalized difference vegetation index (NDVI, a measure of presence of vegetation) values showed roughly 25% greater ground coverage in resident vegetation plots, indicating that there was much more cover crop biomass that had grown up, but that native vegetative grew out to cover more soil area.
In row middles, sheltered temperature loggers were placed at 2 in., 3 ft. and 5 ft. height, and soil temperatures were measured at 2.5 in. depth. Frost protection irrigation was not utilized during this period. Figure 3 shows an example of the temperature fluctuations in the resident vegetation vs cover cropped plots. Topsoil temperatures were cooler in the cover cropped treatments than in the resident vegetation, which indicate that the cover crops act as a barrier to heat flow and storage in the soil. However, temperatures at 5 ft. during the critical frost periods were nearly identical between treatments. We plan to directly measure bud temperature in 2019 to better understand whether conditions experienced by the buds are different in cover cropped or resident
vegetation areas.
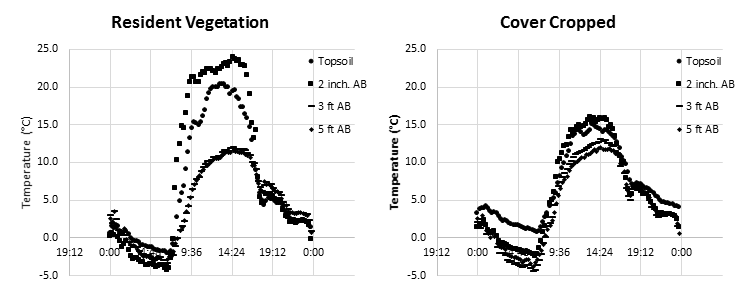
Figure 3. Average temperatures (degrees C) in the resident vegetation (left graph) and the cover cropped (right graph) treatments from the frost event occurring February 19, 2018. Temperatures were measured in the topsoil and at 2 inch, 3 feet, and 5 feet above ground (AB). Temperatures at 5 ft were nearly identical between cover cropped and resident vegetation treatments.
Leave a Reply