

A new almond planting should last at least 20 years. With the right varieties, a new almond orchard should be profitable for at least 20 years. Many decisions contribute to successfully meeting that target. One key decision is variety selection. Knowledge of the current and past variety planting trends of almonds in California may be helpful in this decision. Planting trends, total acres planted, as well as acres by variety and county, are released every spring by the CA Department of Agriculture through USDA’s National Agricultural Statistics Service*. Each report includes the last 30 years of planting data.
Current and past planting trends are not absolute predictors of the future commercial success of any variety (Price per pound, market share, etc., should also be considered), but may provide a general idea of future relative production volume by variety. Here are a couple of points I found in reviewing data in the 2018 Almond Acreage Report and the production data in the 2017 Almond Almanac** from The Almond Board of California.
- The seven varieties reported planted at > 5% of the total planting in 2007 (Figure 1) produced 83% of the total crop in 2017 (Table 1). The percentage of the crop produced by those varieties was in the same ranking as the % 2007 planting. [There is a slight change for the state production reporting in 2018, with all Butte reported with Butte/Padre and Wood Colony joining the list of varieties with yield separately reported.]
- Few varieties survived/thrived over the past 30 years. From 1990 to 2018, 33 almond varieties are listed in the 2018 acreage report, yet only 7 varieties are major producers in 2017 and all those 7 were commercially available in 1990. Ten of the 33 varieties listed in the 2018 acreage report were not reported planted in 2018. Varieties come and go but few have staying power.
| Variety | 2017 % lbs | 2018 % lbs |
| Nonpariel | 38 | 41 |
| Monterey | 15 | 16 |
| Butte/Padre | 11 | 16 |
| Carmel | 7 | 6 |
| Butte | 5 | combined w Butte/Padre |
| Fritz | 5 | 4 |
| Wood Colony | Not reported separately | 4 |
| Remaining varieties | 17 | 13 |
| Table 1. Percent production by variety in California, 2017 and 2018. Data are from the 2018 Almond Almanac**. Production is measured in pounds. |
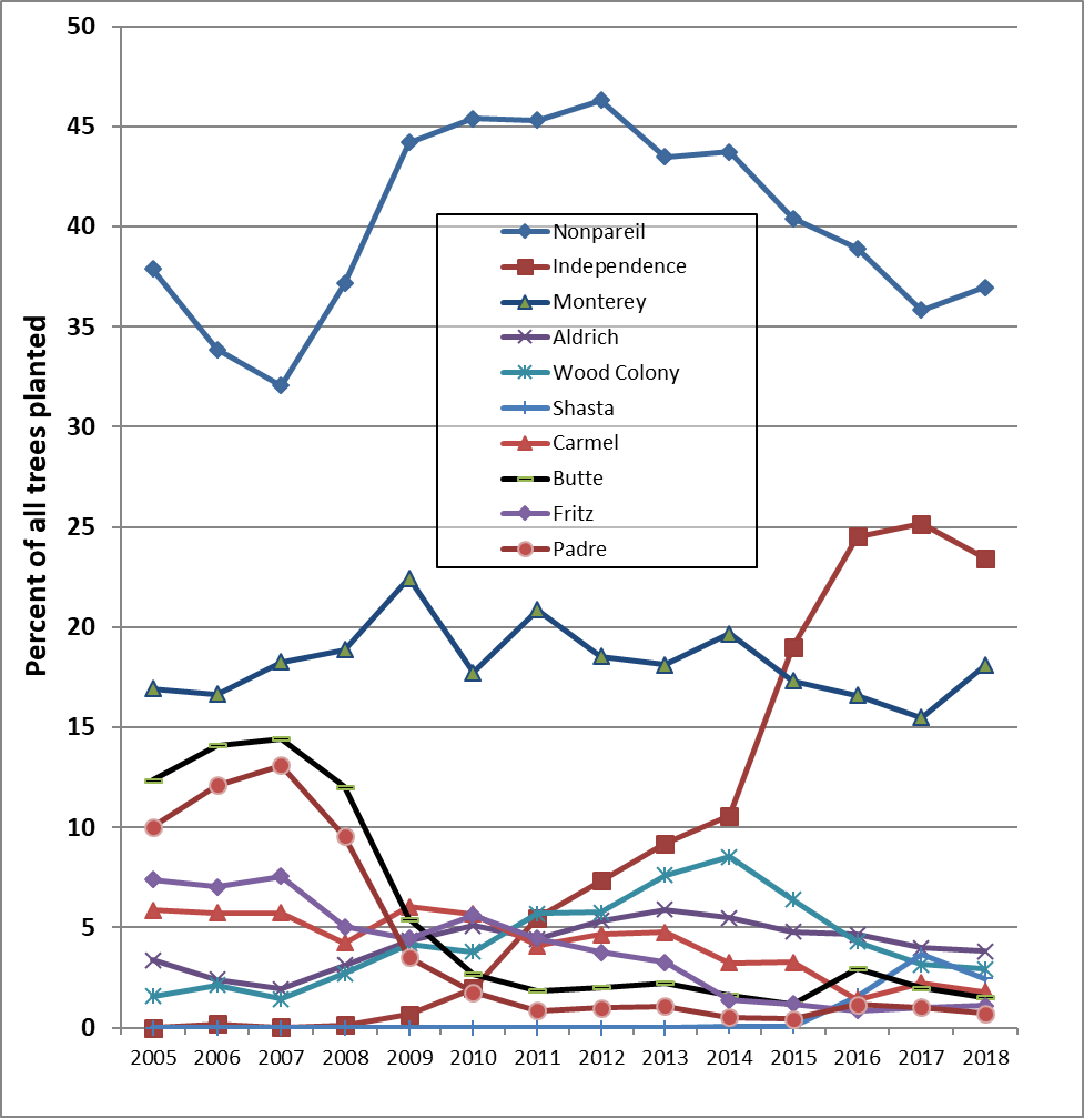
Figure 1. Almond nursery tree planting trends, 2005 to 2018. From top to bottom, the legend reads highest to lowest percentage of the listed varieties for 2018. Data Source: 2018 Almond Acreage Report from CDFA*.
*USDA’s National Agricultural Statistics Service
**2017 Almond Almanac
Leave a Reply