

Katherine Jarvis-Shean, UCCE Orchard Advisor, Sacramento, Solano and Yolo Counties
Maciej A. Zwieniecki, Dept Plant Sciences, UC Davis
Orchards up and down the Central Valley sit bare and leafless during winter. But just because we can’t see active growth with our eyes, doesn’t mean the trees themselves aren’t active. We refer to the winter stage of a deciduous tree’s annual cycle as “winter dormancy”, which comes from the old Latin word for sleeping. And similarly to how our bodies keep functioning while we sleep at night, the trees in the Central Valley’s orchards are active all winter, too.
Recent years of research by the Zwieniecki lab (the Z Lab) at UC Davis, including the Carbohydrate Observatory, have been shedding light on what is happening in orchard trees during their yearly cycles, including during this dormant period, and how that interplays with how trees prepare for winter and emerge from dormancy in the spring, to bloom and leaf-out. This research has been used to better explain how trees may be counting winter chill and spring heat. In almond, this new knowledge has been used to create a bloom prediction tool. This is one of many promising avenues to start transitioning from establishing a baseline understanding of carbohydrate seasonal dynamics into finding lessons and creating tools that can be used to improve orchard health and yield.
What Are Non-Structural Carbohydrates?
Non-structural carbohydrates (NSC) are carbohydrates that are not part of structures like cell walls. NSC are utilized by the tree for energy, as building blocks for cell growth, as an osmolyte to influence water dynamics, and as signals for multiple physiological activities. By following the amounts of NSC in a plant over time, we can build a better understanding of how trees are using carbohydrates for current opportunities (vegetative and fruit growth) or future challenges (dormancy, defense against pathogens and other stressors).
NSC are either in the form of soluble carbohydrates (sucrose, hexose, fructose; henceforth simply referred to as “sugars”) or starch. Sugars are the product of photosynthesis, and, roughly speaking, the building blocks of starch. Starch is the storage form of carbohydrates and can later be broken down to provide sugars. You can think about soluble sugars as ‘cash’ and starch as ‘money in the bank’. Sugars are also an active part of biological cell activity and their level in cells are under strict control.
Different enzymes (catalysts) synthesize and break down starch. The enzymes that make starch are typically more active at higher temperatures, whereas temperatures don’t have a big impact on the activity of the starch degrading enzymes. As a result, when it’s warm, trees tend to turn sugars into starch, and when it’s cold, trees turn starch into sugar. For trees to find their “sweet spot” to keep sugar levels in an optimum range, they adjust the concentration of these enzymes using gene expression machinery. Recent research is showing that the effort to maintain this sweet spot likely plays a role in how trees count winter chill and emerge from dormancy in the spring.
How Do Carbohydrates Vary Over the Year?
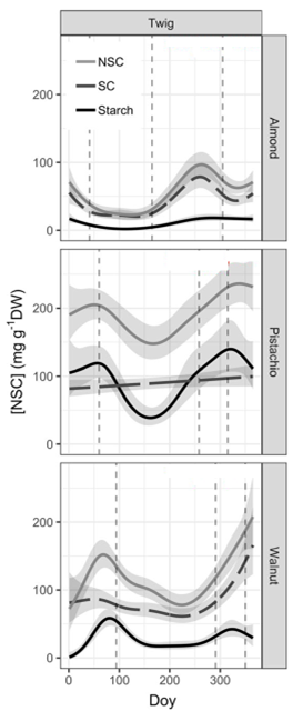
Figure 1. Seasonal variation of NSC concentrations over the year for the different species. Total NSC (grey line), sugars (SC, dashed line) and starch (black line) concentration are modelled from data collected (shaded areas represents variability in the data). Phenological events – bud-break, fruit drop, and leaf abscission – are shown with dashed vertical lines. 1
An intensive sampling was conducted of carbohydrates of almonds, pistachios and walnuts in the twig, branches and trunk over the course of a year.1 As has been seen in other temperate trees, it was found that NSC varies with changing stages of growth or phenology, and concurrent climatic conditions. NSC decreases following bud break, reaches the lowest levels during the growing season, and then increases starting mid-to-late summer to reach maximum levels in fall or early winter (Figure 1, top, grey line). Data from the last three years2 at the Carbohydrate Observatory have shown the same trend in twigs of almonds, pistachios, and walnuts throughout the Central Valley.
Carbohydrates Going into, During and Coming out of Dormancy
As trees move into the fall, NSC increases (Figure 1). Recent research by the Z lab has found that the increasing difference of above and below ground temperatures of fall conditions (cold canopy, warm roots) drives allocation of carbohydrates from canopy bark and branches into roots. Some starch storage is also maintained in the upper canopy.3
Over winter, trees use locally stored NSC for respiration to maintain baseline functions. Sugar is used for respiration, which decreases during dormancy as temperatures decrease, but certainly doesn’t stop. Trees also use sugars as anti-freeze to protect cells and xylem (the tree’s water pipes) from frost damage, as well as to scavenge for damaging free radicals, keep cell membranes stable, and to signal across cells.4
As trees wake up in the spring, they need carbohydrates to grow. Carbohydrates stored in the buds are not sufficient to support the vegetative and fruit growth that occurs before leaves start photosynthesizing to create new sugars. Recent research by the Z lab in walnuts has found that the sugars used for spring growth are imported from both near and far.4 Girdling shoots 4 inches below buds delayed bud break by almost a week and significantly reduced bud size. Branch starch reserves closer to the trunk were drawn down even more than near the growing buds, as the starch was broken down into sugar to send up the shoot to support new growth.
This transport chain reaches all the way down to the roots, an important part of storage of over-winter NSC for use in the spring. The spring temperature differential of cold roots (from cold soil) and warm canopy drive allocation of carbohydrates from roots to canopy. Warm conditions drive starch-making enzymes to make starch in the canopy, thus reducing sugar availability, while cold conditions drive roots to turn stored starch into sugar, which is then circulated up through the xylem (which we usually think of as the water pipes, but in spring also send sugar up into the canopy).
Simply put, getting trees to emerge from dormancy is not just a matter of getting trees to bloom. A whole host of physiological functions need to fire up simultaneously. For synchronous bloom and budbreak within the tree, the whole tree needs to synchronize when it starts supplying buds with energy and water. If growing buds are not supplied with enough carbohydrates in the spring, growth can be delayed or decreased and flowers and nutlets can be aborted.
Carbohydrate Dynamics Predict Bloom
Exactly how trees break dormancy in the spring has remained somewhat mysterious. Winter chill and spring heat accumulation models have been used in combination to help predict bloom timing, but these models can’t explain how trees are tracking the cold and warm temperatures they are experiencing. The Carbohydrate Observatory has found that in almonds, pistachios, and walnuts, shortly before bud break, there is a surge in starch and a dip in sugar concentration. Plants regulate sugar concentrations to maintain desirable metabolism and osmotic dynamics within their tissue. The Z Lab has used this knowledge, and the specific values and thresholds gleaned from the Carbohydrate Observatory to create a model for almond bloom timing, based on fall and winter carbohydrate and temperature dynamics.5
This bloom prediction model, the C-T model6, integrates some important aspects about how plants balance sugar and starch concentrations. Recall that when it’s warm, trees turn sugars into starch, and when it’s cold, trees turn starch into sugar. For trees to keep sugar levels in an optimum range, they adjust the concentration of these enzymes. Because starch synthesis is very temperature sensitive, but starch degradation is not, trees can quickly respond to too much sugar at warm temperatures but can’t respond as quickly to too little sugar.
When conditions warm up in the spring, starch synthesis quickly takes off, pulling sugars out of circulation, resulting in a dip in sugar. This dip in sugar and upsurge in starch is predictive of (and may even trigger) bud break. This relationship may help explain the flash bloom we see after cold winters with a little spring heat, and the straggled bloom we see after warm winters.7 Cold winters would amplify accumulation of starch synthesis enzymes, resulting in less warm time necessary in the spring to trigger a sharp sugar drop and bloom. Warmer winters would downregulate starch synthesis, requiring more warmth than normal in the spring to achieve low sugar levels.
By integrating this knowledge of the principles of carbohydrate dynamics and specific thresholds and ranges learned from the Carbohydrate Observatory, almond bloom timing was predicted in three locations in California over 24 years to within less than 5 days on average (RMSE = 4.7 days) (Figure 2). While this may not be accurate enough for management decisions, it’s better than most bloom prediction models based on chill and heat accumulation alone, which supports integrating these carbohydrate dynamics into our understanding of how trees count the passing of winter and spring.

Figure 2. The C–T model projections of almond bloom time versus the actual bloom records from Durham (1984–2008, red circles), Manteca (1996–2008, blue triangles), and Shafter (1996–2008, orange squares). The 1:1 ratio is denoted by a black line and the root mean square error (RMSE=4.7 days) by a grey ribbon. 5
Many Carbohydrate Questions Remain Unanswered
Carbohydrates are the building blocks of vegetative growth as well as nuts, shells and hulls. The more we understand NSC dynamics, the better we can understand the potential and limitations for growth and yield in our orchards. Recent modeling also indicates that carbohydrates play a critical role in tracking the progress of winter and emerging from dormancy in the spring. We will be building on this baseline understanding to optimize the timing of dormancy breaking treatments in walnuts in the coming years.
The use of data from the Carbohydrate Observatory to build a bud break prediction model demonstrates the huge potential for the next stage of this project. Over the course of the last three years, volunteer growers, mangers, and PCAs have contributed samples to help develop a baseline understanding of the variability of NSC, starch, and sugar across seasons, years, locations and different nut crops. There is so much more that can be done from here. Now that these baseline dynamics are understood, researchers can dig deeper into which orchards perform above or below the baseline and why.
But more robust data sets are needed with collaborator assistance. A machine learning approach is in development to integrate climate and soils data, management metrics like irrigation, and carbohydrate dynamics to predict yield at the time of bloom. But we need collaborators who are willing to share records on yield, irrigation, and orchard health, to build a model that will yield good predictions. So far, the almond industry has been very supportive in providing these data, but we have not had as much luck with walnut collaboration. If you’re interested in helping with this research, please reach out to Paula Guzman-Delgado at pguzmandelgado@ucdavis.edu.
1 Tixier, A., Guzmán-Delgado, P., Sperling, O. et al. Comparison of phenological traits, growth patterns, and seasonal dynamics of non-structural carbohydrate in Mediterranean tree crop species. Sci Rep 10, 347 (2020). https://doi.org/10.1038/s41598-019-57016-3
2 Interact with Carbohydrate Observatory data at https://zlab-carb-observatory.herokuapp.com/
3 Sperling, O., Silva, L.C.R., Tixier, A. et al. Temperature gradients assist carbohydrate allocation within trees. Sci Rep 7, 3265 (2017). https://doi.org/10.1038/s41598-017-03608-w
4 Tixier, A., Sperling, O., Orozco, J. et al. Spring bud growth depends on sugar delivery by xylem and water recirculation by phloem Münch flow in Juglans regia . Planta 246, 495–508 (2017). https://doi.org/10.1007/s00425-017-2707-7
5 Sperling, O., Kamai, T., Tixier, et al. Predicting bloom dates by temperature mediated kinetics of carbohydrate metabolism in deciduous trees. Ag For Met 276–277, (2019) https://doi.org/10.1016/j.agrformet.2019.107643
6 Test out the C-T model for almond bloom prediction using your nearest CIMIS station at http://zlab-chill-heat-model.herokuapp.com/
7 Pope, K.S., Da Silva, D., Brown, P.H., DeJong, T.M. A biologically based approach to modeling spring phenology in temperate deciduous trees. Ag For Met 198, 15–23 (2014). https://doi.org/10.1016/j.agrformet.2014.07.009
Leave a Reply