

Luke Milliron, UCCE Orchards Advisor, Butte, Tehama & Glenn Counties; and Allan Fulton, UCCE Water Resources Advisor, Tehama, Shasta, Glenn & Colusa Counties.
Storms throughout the winter and into early spring, have resulted in localized flooding in the Sacramento Valley and left standing water or a shallow perched water table in many orchards in the region. We have updated our rainfall tracker to explore just how wet it has been. The tracker in mid-December showed how dry October had been in comparison to the historical average, and how rainfall levels were closer to normal levels in November in December. This update shows the extent of above-average rainfall in different parts of the Sacramento Valley in January through March.
The extent of late winter rainfall in the Sacramento Valley: Despite a slow start in October, rainfall levels in the 2018/2019 winter easily exceeded historical average monthly rainfall totals throughout the Sacramento Valley (Tables 1-4). In all but one of the four Sacramento Valley CIMIS stations listed below (Williams, Table 3), rainfall levels even exceeded the wet 2016/2017 winter. In particular, February was wet, with rainfall totals generally 2-2.5x the historical average.
| Table 1. Red Bluff (Gerber CIMIS #222) Winter Rainfall (In) | |||||||
| Year | Oct. | Nov. | Dec. | Jan. | Feb. | Mar. | Total |
| Avg. Monthly | 1.2 | 2.8 | 4.2 | 5.0 | 4.1 | 3.2 | 20.5 |
| 2017/18 Winter | 0.2 | 2.2 | 0.0 | 3.1 | 0.1 | 2.4 | 8.1 |
| 2018/19 Winter | 0.5 | 2.4 | 2.8 | 5.5 | 8.7 | 4.6 | 24.5 |
| Table 1. Chico (Durham CIMIS #12) Winter Rainfall (In) | |||||||
| Year | Oct. | Nov. | Dec. | Jan. | Feb. | Mar. | Total |
| Avg. Monthly | 1.4 | 3.3 | 4.6 | 4.8 | 4.4 | 4.3 | 22.8 |
| 2017/18 Winter | 0.5 | 4.0 | 0.1 | 3.5 | 0.3 | 3.4 | 11.8 |
| 2018/19 Winter | 0.7 | 6.4 | 2.9 | 5.4 | 11.3 | 3.7 | 30.5 |
| Table 3. Williams (CIMIS #250) Winter Rainfall (In) | |||||||
| Year | Oct. | Nov. | Dec. | Jan. | Feb. | Mar. | Total |
| Avg. Monthly | 0.8 | 2.4 | 2.9 | 3.3 | 2.6 | 1.8 | 13.8 |
| 2017/18 Winter | 0.2 | 0.1 | 0.0 | 2.3 | 0.1 | 1.9 | 4.6 |
| 2018/19 Winter | 0.5 | 2.0 | 0.8 | 3.5 | 7.0 | 2.8 | 16.5 |
| Table 4. Woodland (CIMIS #226) Winter Rainfall (In) | |||||||
| Year | Oct. | Nov. | Dec. | Jan. | Feb. | Mar. | Total |
| Avg. Monthly | 1.1 | 2.4 | 3.7 | 4.5 | 4.1 | 3.0 | 18.7 |
| 2017/18 Winter | 0.7 | 1.4 | 0.0 | 3.5 | 0.3 | 2.9 | 8.8 |
| 2018/19 Winter | 0.9 | 3.1 | 1.7 | 5.2 | 8.0 | 4.4 | 23.3 |
Most orchards in the Sacramento Valley likely finished the 2018/2019 winter with a full profile of water. In early spring, high rainfall continued in certain places, while other parts of the valley (e.g. west side) received much less. CIMIS shows that April spring showers ranged between 0.14 inches in Williams to as much as 1.32 inches in Durham. North of Chico on April 2nd a severe storm event resulted in 4.07 inches of rainfall according to the Western Weather Group’s rain gauge (see figure 1).
Of course, not all rainfall was effectively stored in the soil profile as it depends upon the soil conditions and intensity of the storm. Relatively wet soils and particularly those with rolling topography will be prone to more runoff, especially if it is an intense storm. Light showers may be prone to evaporation, especially if they are followed by warmer, sunny weather. An orchard floor with vigorous winter vegetation will also transpire water and reduce stored moisture. As a general rule of thumb, on average only 50 to 60 percent of the actual rainfall will likely be effectively stored in the soil profile. Most recently, increasing temperatures have come at full speed to the valley in mid- to late-April.
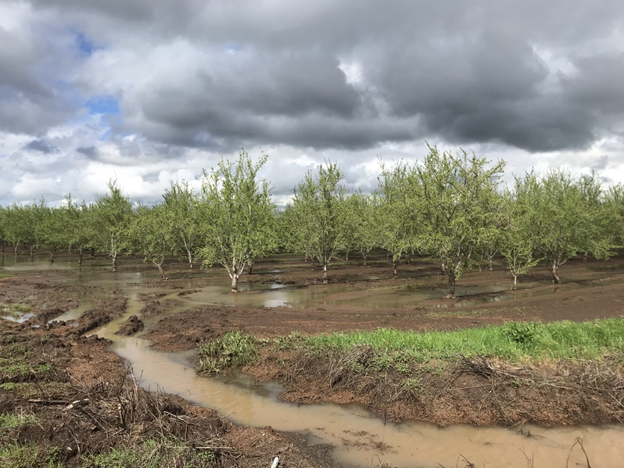
Figure 1. A flooded almond orchard northwest of Chico, CA on April 5th following a localized severe storm on April 2nd (photo by Luke Milliron).
Ground Truthing: Given how variable spring rains have been throughout the Sacramento Valley, it isn’t much of a surprise that recent auger evaluations by farm advisors have shown very different levels of soil moisture depletion between the east and west side of the valley. Checking soil moisture by hand is a very basic method that allows you to evaluate the contribution of rainfall and irrigation events. There are many online stores where soil augers can be purchased (try: JMC Backsaver, AMS samplers; Forestry Suppliers; and/or Ben Meadows). Choose equipment that allows you to easily and rapidly take soil samples at least three foot deep (for example samplers see figure 2). Evaluating soil moisture depletion by feel can be an informative practice as part of your management routine. The USDA, NRCS also offers a nicely prepared publication with color pictures titled Estimate soil moisture by feel and appearance.
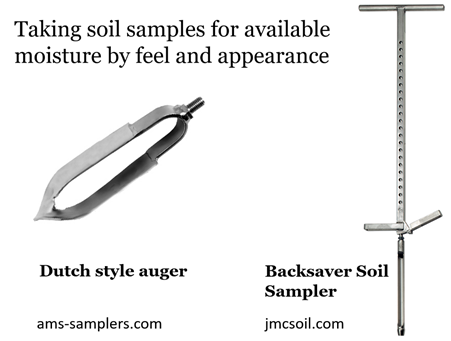
Figure 2. Examples of soil samplers for evaluating soil moisture depletion by feel: The Dutch style auger is designed for quickly taking soil samples in heavier textured soils, while the Backsaver soil sampler allows for sampling discrete cores as deep as 46 inches, depending on the sampling tube attached. Source: Adapted from AMS Samplers and JMC Soil Samplers, respectively.
Deciding when to start the irrigation season is arguably one of the most critical decisions for irrigated orchards. Avoiding tree damage from unintended anerobic conditions, is one concern with beginning to irrigate too early. The three main irrigation management approaches that can help you decide early season irrigation timing are the pressure chamber (or pressure bomb), evapotranspiration (ETc), or soil moisture monitoring. While the pressure chamber is the most direct approach to determining the need for orchard irrigation, ETc and soil moisture provide valuable information on the amount of water loss, and the extent of irrigation replenishment, respectively. See this article which discusses these three approaches more fully.
Leave a Reply