

Domena A. Agyeman, UCCE Ag and Natural Resources Economic Advisor; Butte, Glenn, and Tehama Counties
Walnut production costs remain elevated, and overall profitability continues to hinge on how well growers can manage key cost drivers. With margins still tight, understanding where costs have increased over time could benefit growers in identifying areas where savings may be possible.
Figure 1 shows walnut production costs per acre in the Sacramento Valley, expressed in 2025 dollars to allow fair comparison across years. This adjustment removes general inflation, so differences between years reflect real changes in production costs. Total costs, consisting of operating, cash overhead and non-cash overhead costs increased steadily from $4,805 per acre in 2007 to $8,081 per acre in 2022, representing a 68% increase. Non-cash overhead costs experienced the largest increase (89%), followed by operating costs (62%) and cash overhead costs (19%).
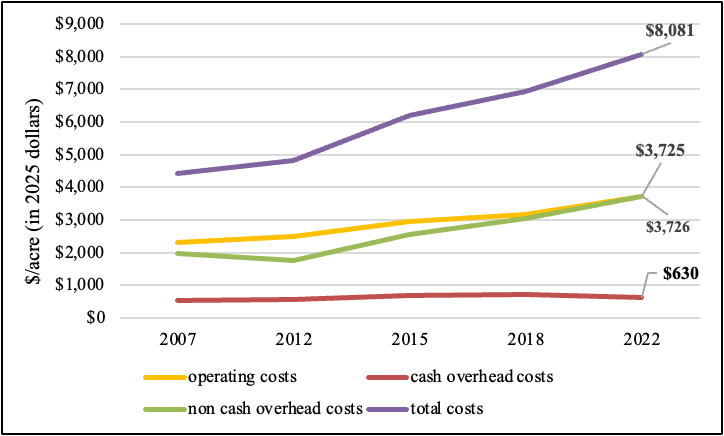
Figure 1. Per-acre costs of walnut production in the Sacramento Valley (adjusted to 2025 dollars using GDP price deflator). Source: UC ANR cost and return studies.
Operating costs include annual production costs such as labor, fertilizer, harvest, and interest on operating loans. Cash overhead costs are whole farm expenses paid in cash that are not tied to a specific operation, such as office expenses, field sanitation, equipment repairs, or property taxes. Non-cash overhead costs are ownership expenses, representing annual depreciation and interest on farm investments like wells, irrigation systems, land, and orchard establishment costs.
Cost changes between 2018 and 2022 are the most recent available from UC ANR and are therefore the most relevant for guiding current management decisions. Over this period, total production costs increased 25%, driven primarily by operating costs (up 26%) and non-cash overhead costs (up 32%). Within non-cash overhead, establishment costs were the main contributor, doubling between 2018 and 2022 and increasing their share of non-cash overhead from 29% to 44%, largely due to rising interest rates. Land costs rose about 10% over the same period and remained the largest component of non-cash overhead, accounting for 47% in 2022, a decline from 57% in 2018.
A closer look at operating cost components between 2018 and 2022 shows that much of the cost increase was concentrated in fertilizer, irrigation, machinery, operating loan interests, and labor costs. Fertilizer costs and the cost of pumping irrigation water doubled, while expenses for operating machinery, including gasoline, diesel, lubricants, and repairs increased by 95%. Interest paid on operating capital increased by 72% following the rise in operating loan interest rates. Labor costs also increased by 35%, adding further pressure to operating margins.
Together, irrigation, fertilizer, and labor costs accounted for 22% of total operating costs in 2018 rising to 33% in 2022. In contrast, pest management costs (herbicide, fungicide, bactericide, insecticide, and rodenticide) declined from 25% to 20% of operating costs. This shift can be attributed to several key factors. Supply disruptions following the COVID-19 outbreak, combined with the rise in U.S. natural gas prices between 2020 and 2021, significantly increased the cost of nitrogen production in the U.S., as natural gas is a key component in nitrogen fertilizer production. In addition, drought conditions between 2020 and 2022 reduced surface water deliveries and increased irrigation water pumping costs. Decrease in the overtime threshold for agricultural workers, along with the steady increase in the minimum wage (from $11 per hour in 2018 to $14 per hour in 2022), contributed to rising labor expenses. Irrigation and labor expenses are likely to continue growing as a share of operating costs in the coming years, driven by stricter groundwater management policies and labor regulations that raise labor costs. For reference, California’s minimum wage is $16.90 per hour as of January 2026, with agricultural workers entitled to 1.5 times the regular rate for overtime. Harvest costs rose about 11% between 2018 and 2022, though their share of operating costs declined from 38% to 34% over the same period.
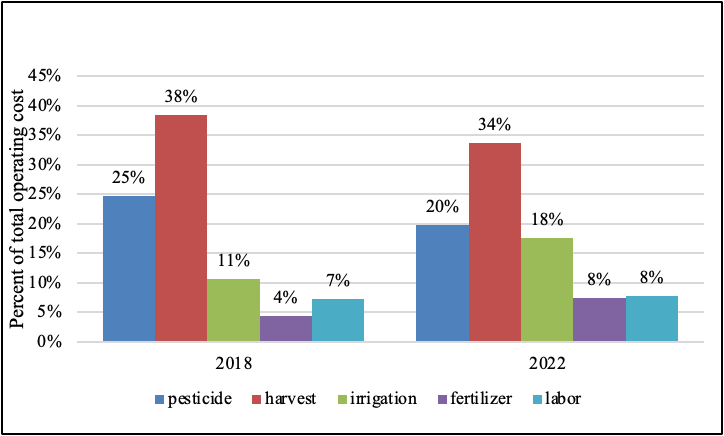
Figure 2: Percentage of total operating costs by cost category for walnut production in the Sacramento Valley 2018 and 2022. Source: UC ANR cost and return studies
In addition to depressed walnut prices, recent cost trends underscore that walnut profitability is increasingly shaped by rising production costs. Although growers have limited control over factors such as market prices, interest rates, and irrigation water costs, understanding which cost categories are rising most rapidly can help identify areas where management adjustments may improve profitability. Optimizing irrigation efficiency, nutrient management, and labor allocation as part of annual budgeting and planning decisions may offer opportunities to reduce operating costs in the current environment. Growers can use the UC ANR cost studies, including a downloadable spreadsheet to track their expenses and identify where management adjustments are most needed. Moreover, with interest rates remaining elevated relative to historical levels, careful consideration of orchard establishment timing and financing structure has become increasingly important. This handout from Morrisson provides key financial metrics that can help growers improve access to credit and secure more favorable financing opportunities.
As production costs rise and market prices remain uncertain, your walnut profitability will increasingly depend on how well you adapt your management practices, control costs you can influence, and make sound investment decisions for your orchard.
Leave a Reply