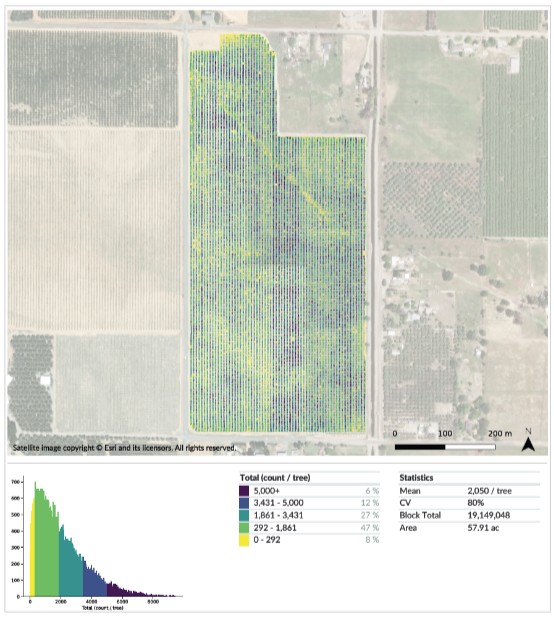
Figure 2. Example of data returned from crop sensing in a prune orchard. Dot colors on the field map indicate the
number of fruit per tree, and total field statistics are summarized beneath the image.


Your source for orchard news & information in the Sacramento Valley
Technology Spotlight: Cropload Estimation in Prunes
Figure 2. Example of data returned from crop sensing in a prune orchard. Dot colors on the field map indicate the
number of fruit per tree, and total field statistics are summarized beneath the image.
Leave a Reply