

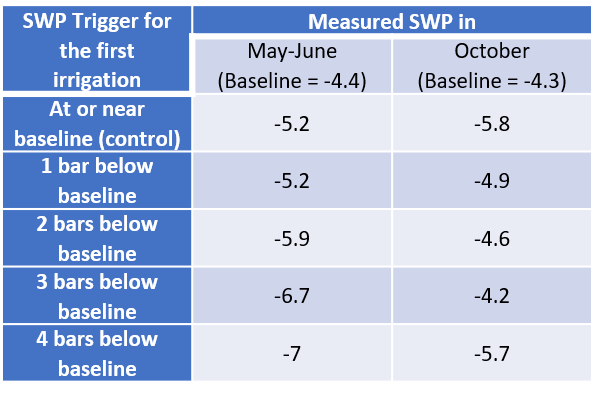
Table 2. Average SWP measured in May and June 2014, when irrigation was being delayed in most of the treatments, and average SWP in October around harvest (October 17, 2014). Also shown are the baseline SWP values for the same time periods.
Table 2. Average SWP measured in May and June 2014, when irrigation was being delayed in most of the treatments, and average SWP in October around harvest (October 17, 2014). Also shown are the baseline SWP values for the same time periods.
Leave a Reply