Adapted from “Counting Winter Chill”, published in the Sacramento Valley Walnut News, January 2017, by Katherine Jarvis-Shean, Janine Hasey, & Joe Connell.
The last few years have been highly variable, both in terms of winter chill accumulation and spring bloom and leaf-out behavior. The winter of 2015-2016 had moderate-to-high chill accumulation in the Sacramento Valley and leaf-out in the spring was tight and early. The winter of 2014-2015, on the other hand, had low chill accumulation and leaf out was late and straggled. We documented this in Chandler, but also saw it in other mid-to-late leafing, mid-to-high chill varieties. What’s driving this behavior? What can we expect this year? And how can one track and interpret chill accumulation?
What drives the timing of leaf-out?
Deciduous fruit species lose their leaves and enter dormancy each fall. This dormancy has external and internal requirements for growth to begin again in the spring. The first is favorable external conditions facing the plant, primarily adequate moisture and favorable temperatures for growth. Even if temperatures and moisture conditions are favorable, there is a period during the winter when trees will not grow. During this period, growth is inhibited by internal factors when the plant is said to be in “rest”.
Rest is broken by exposure to cold temperatures. All deciduous fruit plants require a certain amount of chilling during the winter rest period to enable their buds to sprout evenly and for good flowering and fruit set to occur in spring. The winter chilling requirement to break this rest period varies with plant species and even with particular varieties within the same species. Early leafing walnut varieties require less chilling than later leafing varieties (Table 1). Insufficient winter chilling prolongs rest and results in delayed and uneven bloom and leafing the following spring. Bud drop and reduced set may also occur and consequently, production and quality of fruits and nuts may be poor.
| Cultivar | Chill Hours Requirement* | Chill Portions Requirement |
| Payne | 627 | 38 |
| Serr | 827 | Not available |
| Hartley | 984 | 54 |
| Chandler | 1015 | 45-50 |
| Howard | 1015 | Not Available |
| *Chilling hours required to break bud after 15 days at 71.6°F. From Gale McGranahan et. al., Walnut Improvement Program 2006, Walnut Research Reports 2006, pg 10. |
What can we expect this year in terms of winter chill?

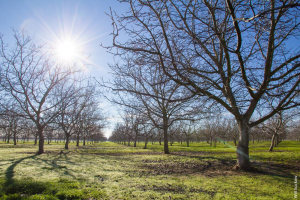
Dormant walnut orchard. Photo credit: W. Suckow, 2016.
We don’t have tools yet for predicting whether winters will be low, medium or high chill before they start. We do know that historically, low chill winters occur every 10-15 years. We had a low chill winter in 2014-2015, so it seems less likely that this would also be a low chill winter. But our climate has been doing some unusual and record-breaking things in the last few years, so past behavior is not a guarantee of future behavior. We also know that in the past, December and January have been our most critical months for chill accumulation. So if you’re going to keep an eye on chill accumulation, those are the months to pay attention.
How to track and interpret chill accumulation?
There’s growing evidence that the newer Chill Portions Model, also sometimes called the Dynamic Model, may be the more accurate model to use for tree crops in California and in other Mediterranean climates. The math behind Chill Portions is more complex than Chill Hours, which just counts each hour between 32-45° F as one chill hour (or even more simply, each hour under 45° F). But, while Chill Portions has some complex equations, it’s based on some fairly simple components. There are three basic things that make Chill Portions different from Chill Hours:
- Chill Hours counts any hour between 32°-45° F as the same. Chill Portions gives different chill values to different temperatures. No more wondering about the value of ‘warm’ chill hours. Temperatures between 43°-47° F have the most chill value. The chill value on either side of that range are lower, dropping to no value at 32° F and 54° F.
- Chill Hours only count up to 45° F. Chill Portions count up to 54° F. This makes Chill Portions better able to approximate effective chilling for the trees we grow, most of which evolved in fairly mild climates.
- Chill Hours does not subtract for warm hours. With the Chill Portions model, warm hours that closely follow cold periods can subtract from the running total of chill accumulation.
In recent years, Chill Hours and Chill Portions have counted winters differently. In the winter of 2013-2014, the Chill Portions model showed low chill accumulation, whereas we had average to high Chill Hours accumulation. Both models counted low chill for the winter of 2014-2015. In Davis, leaf-out was eight days later than average in 2014 and 11 days later than average in 2015, indicating that walnut buds responded to both winters as low chill.
Because Chill Portions is much newer than the Chill Hours model, researchers don’t have exact estimates for the chilling requirements of all California’s important tree crops and cultivars. While researchers work on that, it may be valuable to watch chill accumulation with both models to see if, as occurred in 2013-14, one indicates normal winter conditions while the other indicates leafing and bloom is likely to be more sporadic.
Chill accumulation for both models using CIMIS weather station data, along with additional information on the models, how to calculate accumulation with your own weather data, and estimates of chilling requirements for some crops in Chill Portions is available at the UC Fruit and Nut Center website. Because there is not a CIMIS station close to Yuba City, Janine Hasey calculates chill based on a temperature recorder at the UCCE office in Yuba City and weekly updates of chill accumulation in Yuba City will be posted. To receive those updates via email, subscribe to the blog and select walnut updates in addition to any other categories of interest.


Leave a Reply